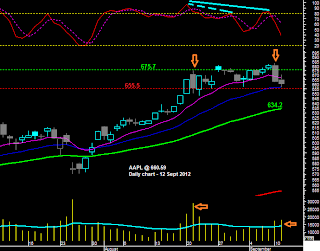
If bulls can hold previous lows (on closing basis) and regain 525, our view might be wrong, at least for the short term.
Sunday, December 16, 2012
AAPL - Nasty chart
A divergence between price and Weekly MACD is a strong signal. Under 604 one should expect the worst...
SPY - Forget the cliff...
A divergence between price and Weekly MACD is a strong signal...
First close under 10 days e.m.a. since 19/11/2012. Looking down if price does not regain Thursday close (142.63).
This leg down is still very similar to the previous "healthy ones", so stay away from the short side above 143 and perhaps right above 142.63 (if you have an "aggressive profile).
Tuesday, December 4, 2012
S&P500 - Above 1379...
First i must emphasize that one should give the index some credit as price regained 200 days e.m.a.
In the meanwhile, weekly chart is still perfectly clear and one should keep in mind its strong signals as they have be very useful in the past few years. (WATCH MACD).
In the meanwhile, weekly chart is still perfectly clear and one should keep in mind its strong signals as they have be very useful in the past few years. (WATCH MACD).
Again, one should remind the furious (with big volume) break down of the neckline so widely discussed. With another bearish divergence, oscillator is "leaving" overbought zone after, what looks like, a failed test to previous lows (and supports).
Obviously, get ready for some weird and aggressive "fiscal cliff spikes", but i really think price behavior can and will, give us some clues! Watch 1408.75 and 1422.38 on the upside, expect 1380 or even new lows if markets fail here...
Wednesday, November 28, 2012
Thursday, November 15, 2012
SPX - After 1375...
As a reminder (read more here "The end"):
"First target around 1375 and second is... Well, we will get back to these charts if price tests 1375 or 1437"
"First target around 1375 and second is... Well, we will get back to these charts if price tests 1375 or 1437"
4th November SPX @ 1414.20
As expected, price tested 200 days e.m.a.. Price action after that test was strongly bearish: a week trading around 1375 incapable to get back on track.
If price can´t get back above 1375/82 one should expect the index to give up all his gains for the year and trade under 1270. This is the second target. Back to the formula if SPX closes 2 days above 1382 or under 1270.
One small alert, SPX have an important support around 1345/52, which can always get the bulls back on his feet again, at least for a while!
K.I.S.S. -"Keep It Simple (and) Stupid"
Friday, November 2, 2012
SPY above 142.24/8
Weekly charts are still on "building long term top", but ST is the key for "P/L action"...
Wednesday, October 24, 2012
SPY - A clear break down, but...
I really don´t think its another (bear) trap (Weekly chart). In the meanwhile, watch for a short term up move if SPY holds above 142.25...
Saturday, October 13, 2012
SPY - Bearish bias
Double top?
Under 143.30 i will sell any rally, targeting 140.35 and then 200 days e.m.a. (Friday at 135.75).
QQQ - Under 67.06...
Two scenarios:
- Price regains 67.06, i will stay neutral and will wait for a short term bounce.
- Price will not hold above 67.06, i will sell any rally in any time-frame, targeting 65.5 and 64.35.
S&P500 - 1430 tested, now 1396?
As said during the week trading days, i am bearish in all time-frames with SPX under 1430.
Market is also short term oversold, which might let the bulls fight back a bit... Above 1430 expect 1444 or even 1451...
Market is also short term oversold, which might let the bulls fight back a bit... Above 1430 expect 1444 or even 1451...
Wednesday, October 3, 2012
Wednesday, September 26, 2012
AAPL - Enough?
As defended here, I am expecting to trade a test to 50 days or even 200 days e.m.a.. Watch for 683 and most important, the golden retracement (674.47) in the previous resistance area.
As a reminder, this is still an up trend. Watch for 655.5 as bull´s last support before those averages...
As a reminder, this is still an up trend. Watch for 655.5 as bull´s last support before those averages...
Tuesday, September 25, 2012
Wednesday, September 12, 2012
Wednesday, September 5, 2012
Tuesday, September 4, 2012
Subscribe to:
Comments (Atom)


