Keep in mind my (bearish) view under 64.45.
1st plan (Daily and Weekly charts)
Under 64.45 => 62.45/55 or even 61.86/62.19.
Sell above 64.1 targeting 62.61 and 62.21. Wrong @ 64.55
2nd plan (Hourly and 5m charts)
Under 63.73 and specially under 63.59 => 63.07 (rising 50h e.m.a.); 62.5 and 62.12
Sell above 63.50 targeting 63.05 (50%); 62.55 (25%) and 62.15 (25%).
Sunday, January 6, 2013
QQQ - Trading plans
Take a look at these NDX charts first.
1st plan (Daily and Weekly charts):
Under 66.47/8 => 65.13 (gap) or even 64.74 (rising 200 days e.m.a.)
Sell at 66.46 targeting 65.61 and 65.16. Wrong @ 66.77
2nd plan (Hourly and 5m charts)
Under 66.88 => 65.92 (rising 50h e.m.a.); 65.93/6; 65.75; 65.55; 65.28
Sell above 66.6 targeting 66.06 and 65.31. Wrong @ 66.91
1st plan (Daily and Weekly charts):
Under 66.47/8 => 65.13 (gap) or even 64.74 (rising 200 days e.m.a.)
Sell at 66.46 targeting 65.61 and 65.16. Wrong @ 66.77
2nd plan (Hourly and 5m charts)
Under 66.88 => 65.92 (rising 50h e.m.a.); 65.93/6; 65.75; 65.55; 65.28
Sell above 66.6 targeting 66.06 and 65.31. Wrong @ 66.91
Nasdaq-100 - Trading view
Relative weakness is a surprise in the last 4 years when talking about techs. Anyway, we can, again, be facing a new bottom.
While the weekly chart can (now) point for a bottom after a strong gap up on the 1st trading day of 2013, what should one expect in the near term? What might happen if price breaks 2713?
If NDX fails here, I will be looking to a gap close or even a new test to 200 days e.m.a.
AAPL - Trading view
This is a real Nasty chart, but what if price can hold 525/28?
Above 528 one should expect 535 or even 543 (How will look the daily chart if this happens?)
Saturday, January 5, 2013
AUD, EURO, CHF & JPY
Here are some key crosses from the risk taking appetite perspective.
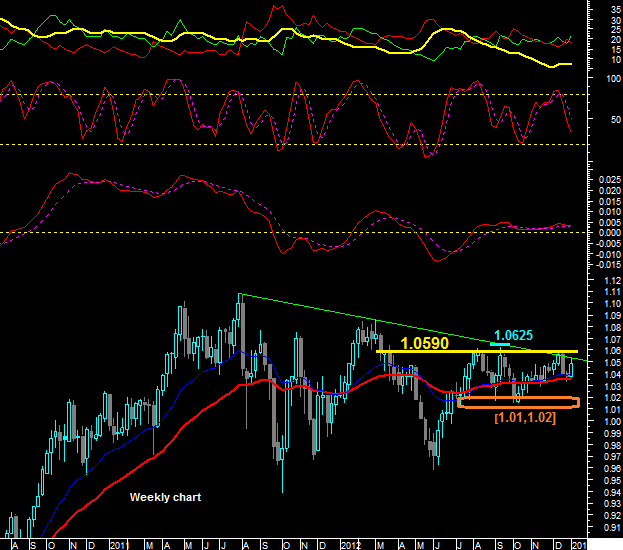
AUD - Sideways : 1.01 and 1.0625
EURO - Trying to avoid the void... Must regain 1.3172. Real danger under 1.2935...
AUD - Sideways : 1.01 and 1.0625
EURO - Trying to avoid the void... Must regain 1.3172. Real danger under 1.2935...
CHF - Neutral in the range 1.0725/1.0852
JPY - Huge technical damages in this chart. Nothing to do here before some kind of pullback
Gold & Silver
We can go lower and visit long term supports, but... Watch for some bullish divergences here, specially in silver (golden retracement)
Weekly charts (stocks)
Preparing next week plans on these stocks. Medium term view; key levels
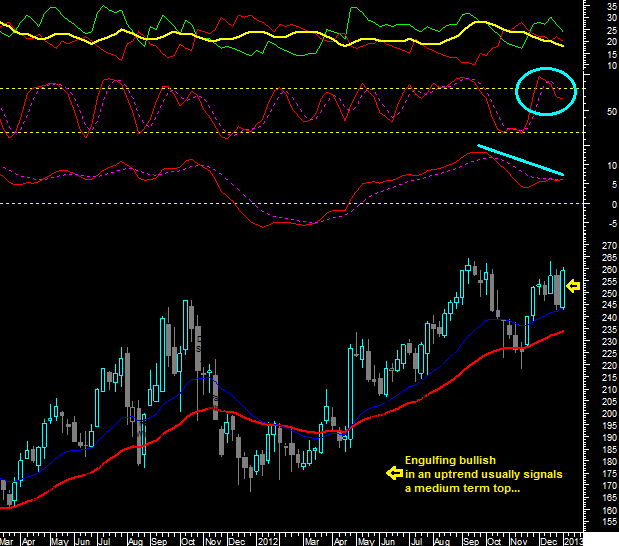
AAPL - 501; 525/527.68 key for longs...
AMZN - Bearish bias
AAPL - 501; 525/527.68 key for longs...
AMZN - Bearish bias
GOOG - 745 key for shorts, wait for some weakness to elaborate a plan
GILD - Can test the highs (>77), Strong bearish under 72.3. Tradable range in between
QCOM - 65.45 is the key level for shorts. Bearish bias under 64.45
Subscribe to:
Posts (Atom)