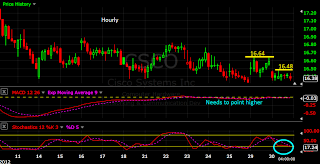
I am expecting more downside in the markets, so this can support only half of a trading plan, as one should trade it against other stock or index (use SPY or QQQ). Look at CSCO as half of a pair trade...
Short term charts are telling me that we are (again) going lower. That´s my expectation if markets can´t take out last week highs (1329.75 ES_F).
Key level to watch for weakness and to get in: 1319, 1314, 1311.5, 1304/6.
The next natural target is in the range [1250,1265].
See also S&P500 - "Underwater" (cash levels)
S&P500 closed under 1371...
Closed also under 1343...
And under 1329...
Ok, one can argue that we are above 1310/16 and that´s the key level for those who defend a (short term) rally. I agree, so I won´t short above that.
As markets start to fall, everyone wants to find the bottom. Technicians use several indicators created from price (momentum indicators) and participants behavior (sentiment indicators).
One could expect, as prices plunge about 10% from the recent highs, that bears are everywhere, but I think that is an incorrect assumption...
As one can easily notest, this can be only the beginning...
Weekly chart is pointing down. In this environment, one should look for rallies to go with the tide. I will...
Short term charts support the idea of a pullback if price manage to hold above 1316. On the upside, we have several resistances, but for now, just accept the idea of a pullback above 1316. Price might accelerate above 1329.
I am bearish, but I accept a pullback...
I was already working with price in early 2000.
Can (really) remember those days, and you?
As I said before, i think this debt driven rally will end as the previous ones.
In the last few weeks, looks like the world is talking about the Head & Shoulders top in the S&P500. They argue about it... "This Head & Shoulders top is:
- A case study
- Very old school, price is going to bounce around the neckline
- To evident to achieve its target, "all" traders would try to trade it, so it won´t succeed...
- This is a bull market, price will hold the neckline, or at least 1352.5
- "To the moon Alice"
- Crash
- None of the above, won´t spend a minute with it"
The answer can make one millionaire its the consensus...
But, but... Wait... Does it? Is it really important to know the answer?
I don´t think so. All I need is an expectation, and a plan to trade it. Here it is:
Expectation
We are going down, with or without pattern, with or without you, ES_F is going to 1300
For me, this is an unquestionable dogma under and only under, 1362.5.
I can call it a bear trap if after a neckline breach, price regains 1366.75.
Plan
- Enter with a(ny) break of Friday´s low (1361.5) (adjust previous positions stops)
- Place a top loss above 1366.75
- Consider to add with a break of April lows (1352.5)
- Adjust stops to breakeven with a break of 1338.5.
- Consider to reduce @ 1318.25
- Close half @ 200 days e.m.a.
- Close balance @ 1290
Why this expectation?
First of all, one should keep in mind a wider view. I have a weekly chart turning down, which makes a bigger correction more defendable.
Back to the daily chart and to its pattern. This kind of behavior, at least from my point of view, can create frustration and I am expecting that frustration to bring out the sellers. As a reminder, AAPL numbers, FED´s day and the "NoEurope" phenomenon on May 1st, supported the last pullback from, i can call it this way, the neckline.
All these goods thrown at the markets without a real run from the price, can turn this frustation into fear and that´s what I think is going to happen if price breaks the neck.