Wednesday, February 27, 2013

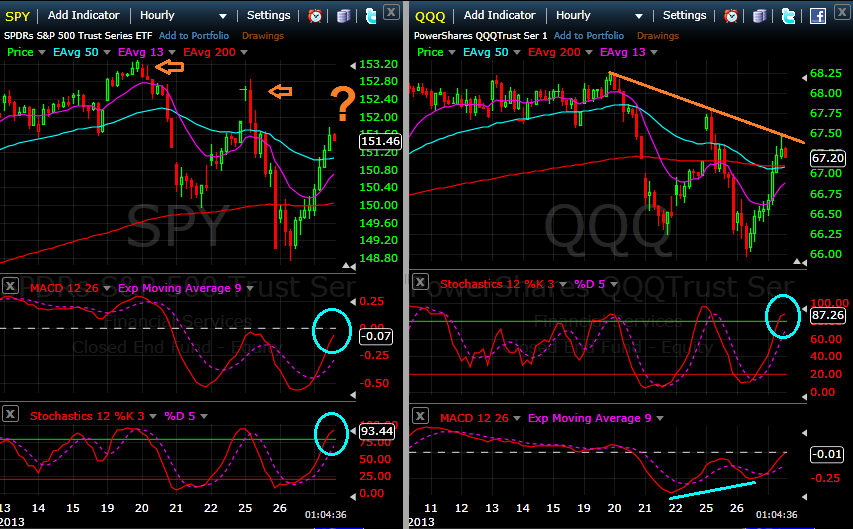
Strong pullback from new short term lows

Keep in mind weekly and daily levels.

Can Bears finally make a score or had we another bottom and are going straight up to 1550?


Tuesday, February 26, 2013

Simple study (saturday Feb 23rd)

Under 1495 one should expect 1466 or even 1415/37.

Keep in mind weekly chart (if) under and last years highs...


Sunday, January 13, 2013

QQQ - Trading view (13012013)

Can market participants become even more bullish? Sure! But there´s already a lot of optimism (sentiment update). Indeed, i think there is enough optimism to call this a medium term top...

The hanging man was followed by an engulfing bullish (bearish pattern after a rally) on Friday, but is this price action enough to call this a top?


No, its not! 
Bulls are still in control, although overbought, market can extend this move up before a pullback. A daily close above 67.34 can "definitely" postpone a move down.
Short term up target above 69.20. New highs in 3/5 weeks.

If price can´t get over this area and closes under 67.06 (an hourly close would "be enough"), then bears have a chance to test medium term exponential moving averages (50 & 200 days), closing the huge gap up from January the 2nd...


Friday, January 11, 2013

SENTIMENT

Bears everywhere right?

I DON´T THINK SO...


And how do "they" behave near the top?


Thursday, January 10, 2013

S&P500 - After avoiding the void...

Here is the leader testing last year highs.

As a reminder, all time highs are just 5% away, and a plunge down to March 2009 would represent a move 12 times greater than the one needed to test the highs...

From an investor perspective, and for those who care about history, where is the favorable reward/risk ratio? 

Low volume and  big complacency from the players should keep price unable to sustain above 1475, but don´t be stubborn as markets can extend this rally before a major top is reached...


Nasdaq-100: Hanging Man

The pattern is clear, even more important near a resistance. The Hanging man points to a top.

Obviously wrong above 2751 (on closing basis).


Sunday, January 6, 2013

QCOM - Trading plans

Keep in mind my (bearishview under 64.45.

1st plan (Daily and Weekly charts)

Under 64.45 => 62.45/55 or even 61.86/62.19.

Sell above 64.1 targeting 62.61 and 62.21. Wrong @ 64.55

2nd plan (Hourly and 5m charts)


Under 63.73 and specially under 63.59 => 63.07 (rising 50h e.m.a.); 62.5 and 62.12

Sell above 63.50 targeting 63.05 (50%); 62.55 (25%) and 62.15 (25%).